
In our previous newsletters, we have highlighted that the prices and yields of secondary market trades reported at the Nairobi Stock Exchange (NSE) are at artificial prices, and not reflective of the market, as a majority trades are taking place at grossly inflated prices. The failure of the NSE to carry out any level of scrutiny of the prices being reported for trades has resulted in an absurd yield curve, with a series of peaks and troughs. The prices and yields derived from this yield curve do not provide a sound basis for valuation of portfolios.
The NSE Yield Curve as at 30th June 2011 is reproduced below:

In order to arrive at a “genuine” yield curve representing actual market realities, we have been discriminatory in the inputs used in preparation of our Yield Curve. The inputs used by us are:
| Period | Input | Value | Comment |
|---|---|---|---|
| 1 Day | Overnight Inter-bank rate | 7.57% | Actual average inter-bank rate reported by the CBK |
| 182 days | 182-day Treasury Bill Yield at the latest auction | 9.90% | Actual 182-day yield as reported by the CBK |
| 2 years | Secondary market trades on recently re-issued 2 year bond | 11.90% | Trades reported post re-issue of bond, which appear to be arms distance deals |
| 5 years | Average issue rate at the recent auction | 12.53% | Yield on auction dated 27/6/11 used – no secondary trades reported since date of auction |
| 20 years | Average rate at the recent auction | 14.82% | Yield on auction dated 27/6/11 used – no secondary trades reported since date of auction |
| 30 years | Judgemental input | 15.25% | For completeness, yield on the longest outstanding bond is required. Judgemental input, assuming a flattish yield curve at the long-end |
The number of points of input for determining the yield curve is about 1-2 fewer than we should ideally have; however, given a fairly flat curve at the long-end, this is not a critical issue. Using these inputs, the yield curve determined by us is as under:
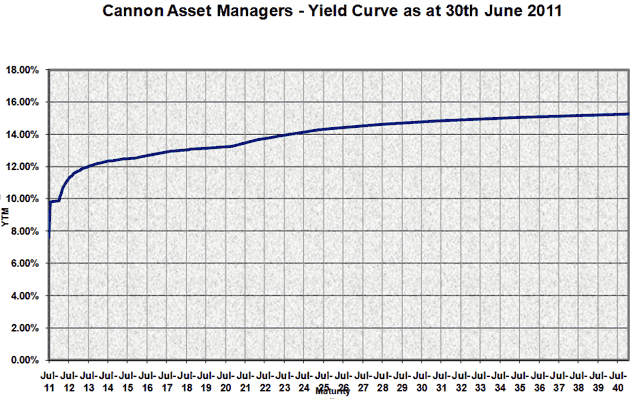
The methodology adopted by us results is a mildly upward sloping curve, which is reflective of the actual market conditions as seen at the last primary auction. This is also very similar to the Yield curve prepared by CFC Stanbic Financial Services, who are the only broker who appear to have produced a yield curve independent of the NSE.
We have used this yield curve to determine the prices of all outstanding Treasury bonds using logarithmic linear interpolation. We give below the table of all outstanding bonds and the prices using the above methodology. We have also provided the NSE prices of the same for comparison.
The purpose of this exercise is to enable investors to carry out a “Real” Mark to Market valuation of their bond portfolios for management information. We will be using these prices for valuations of portfolios managed by us.
| Issue No. | Maturity Date | Coupon | YTM | Clean Price | Dirty Price | NSE Clean Price | NSE Dirty Price |
|---|---|---|---|---|---|---|---|
| FXD2/2006/5 | 25/07/2011 | 11.250% | 9.77% | 100.07 | 104.92 | 100.20 | 105.08 |
| FXD2/2004/7 | 15/08/2011 | 7.000% | 9.82% | 99.61 | 102.23 | 99.79 | 102.42 |
| FXD2/2003/8 | 19/09/2011 | 7.000% | 9.84% | 99.35 | 101.29 | 99.56 | 101.52 |
| FXD3/2009/2 | 19/09/2011 | 8.750% | 9.84% | 99.72 | 102.15 | 99.93 | 102.38 |
| FXD1/2005/6 | 19/12/2011 | 13.000% | 9.85% | 101.40 | 101.76 | 101.38 | 101.78 |
| FXD1/2007/5 | 23/01/2012 | 11.250% | 10.14% | 100.58 | 105.43 | 100.59 | 105.47 |
| FXD1/2010/2 | 30/01/2012 | 8.000% | 10.22% | 98.75 | 102.05 | 98.78 | 102.10 |
| FXD1/2004/8 | 12/03/2012 | 7.500% | 10.63% | 97.92 | 100.15 | 98.08 | 100.32 |
| FXD2/2010/2 | 26/03/2012 | 7.108% | 10.73% | 97.47 | 99.31 | 97.67 | 99.52 |
| FXD1/2003/9 | 14/05/2012 | 12.750% | 11.04% | 101.36 | 102.94 | 101.72 | 103.33 |
| FXD1/2006/6 | 18/06/2012 | 11.750% | 11.20% | 100.48 | 100.80 | 100.95 | 101.31 |
| FXD2/2003/9 | 16/07/2012 | 9.500% | 11.31% | 98.25 | 102.53 | 98.79 | 103.10 |
| FXD2/2007/5 | 20/08/2012 | 9.500% | 11.43% | 97.96 | 101.33 | 98.61 | 101.97 |
| FXD3/2007/5 | 17/09/2012 | 9.500% | 11.51% | 97.75 | 100.39 | 98.40 | 101.04 |
| FXD3/2010/2 | 24/09/2012 | 3.814% | 11.53% | 91.36 | 92.34 | 91.93 | 92.91 |
| FXD2/2006/6 | 19/11/2012 | 11.500% | 11.66% | 99.78 | 100.98 | 100.48 | 101.68 |
| FXD4/2010/2 | 24/12/2012 | 4.586% | 11.72% | 90.53 | 90.57 | 91.04 | 91.08 |
| FXD1/2006/7 | 21/01/2013 | 13.250% | 11.77% | 102.03 | 107.74 | 102.56 | 108.27 |
| FXD1/2008/5 | 21/01/2013 | 9.500% | 11.77% | 96.83 | 100.93 | 97.31 | 101.41 |
| FXD1/2011/2 | 25/02/2013 | 5.284% | 11.83% | 90.39 | 92.16 | 90.73 | 92.50 |
| FXD1/2007/6 | 22/04/2013 | 11.500% | 11.90% | 99.33 | 101.42 | 99.40 | 101.49 |
| FXD2/2008/5 | 22/04/2013 | 9.500% | 11.90% | 96.16 | 97.88 | 96.22 | 97.94 |
| FXD2/2011/2 | 22/04/2013 | 7.439% | 11.90% | 92.89 | 94.24 | 92.94 | 94.29 |
| FXD1/2003/10 | 10/06/2013 | 13.250% | 11.97% | 102.14 | 102.76 | 102.32 | 102.94 |
| FXD2/2003/10 | 12/08/2013 | 8.500% | 12.05% | 93.49 | 96.67 | 93.75 | 96.93 |
| FXD3/2008/5 | 19/08/2013 | 9.500% | 12.06% | 95.26 | 98.63 | 95.54 | 98.90 |
| FXD4/2008/5 | 21/10/2013 | 9.500% | 12.13% | 94.81 | 96.53 | 95.18 | 96.90 |
| FXD2/2006/7 | 16/12/2013 | 12.000% | 12.18% | 99.61 | 99.94 | 100.11 | 100.44 |
| FXD1/2006/8 | 17/02/2014 | 13.250% | 12.23% | 102.19 | 106.89 | 102.82 | 107.52 |
| FXD1/2007/7 | 21/07/2014 | 9.750% | 12.34% | 93.55 | 97.76 | 94.37 | 98.57 |
| FXD1/2009/5 | 15/09/2014 | 9.500% | 12.37% | 92.56 | 95.20 | 93.44 | 96.08 |
| FXD1/2007/8 | 16/02/2015 | 12.750% | 12.44% | 100.86 | 105.38 | 108.13 | 112.65 |
| FXD1/2006/9 | 13/04/2015 | 13.500% | 12.46% | 103.02 | 105.73 | 112.75 | 115.46 |
| FXD1/2010/5 | 18/05/2015 | 6.951% | 12.47% | 83.39 | 84.12 | 93.17 | 93.90 |
| FXD2/2010/5 | 23/11/2015 | 6.671% | 12.53% | 80.63 | 81.20 | 80.57 | 81.14 |
| FXD1/2011/5 | 25/01/2016 | 7.636% | 12.58% | 83.18 | 86.33 | 94.95 | 98.10 |
| FXD1/2006/10 | 14/03/2016 | 14.000% | 12.62% | 104.74 | 108.62 | 118.86 | 122.74 |
| FXD2/2006/10 | 16/05/2016 | 14.000% | 12.66% | 104.71 | 106.17 | 114.13 | 115.59 |
| FXD1/2006/11 | 11/09/2017 | 13.750% | 12.93% | 103.39 | 107.21 | 125.85 | 129.66 |
| FXD1/2007/10 | 16/10/2017 | 10.750% | 12.94% | 90.72 | 92.67 | 112.21 | 114.16 |
| FXD1/2008/10 | 12/02/2018 | 10.750% | 12.99% | 90.23 | 94.04 | 112.98 | 116.79 |
| FXD2/2008/10 | 16/07/2018 | 10.750% | 13.04% | 89.62 | 94.26 | 117.57 | 122.21 |
| FXD1/2006/12 | 13/08/2018 | 14.000% | 13.05% | 104.27 | 109.23 | 133.45 | 138.41 |
| FXD3/2008/10 | 17/09/2018 | 10.750% | 13.06% | 89.36 | 92.14 | 116.06 | 118.84 |
| FXD1/2009/10 | 15/04/2019 | 10.750% | 13.12% | 88.59 | 90.54 | 101.28 | 103.23 |
| FXD1/2007/12 | 13/05/2019 | 13.000% | 13.13% | 99.33 | 100.69 | 111.92 | 113.28 |
| FXD1/2010/10 | 13/04/2020 | 8.790% | 13.21% | 77.37 | 78.96 | 77.90 | 79.49 |
| FXD2/2010/10 | 19/10/2020 | 9.307% | 13.25% | 79.23 | 80.74 | 103.10 | 104.61 |
| FXD1/2007/15 | 07/03/2022 | 14.500% | 13.65% | 104.64 | 108.66 | 141.58 | 145.60 |
| FXD2/2007/15 | 06/06/2022 | 13.500% | 13.71% | 98.78 | 99.15 | 135.57 | 135.94 |
| FXD3/2007/15 | 07/11/2022 | 12.500% | 13.81% | 92.54 | 93.84 | 120.59 | 121.89 |
| FXD1/2008/15 | 13/03/2023 | 12.500% | 13.89% | 92.03 | 95.26 | 118.55 | 121.78 |
| FXD1/2009/15 | 07/10/2024 | 12.500% | 14.18% | 90.01 | 92.28 | 127.73 | 130.00 |
| FXD1/2010/15 | 10/03/2025 | 10.250% | 14.25% | 76.15 | 78.80 | 107.66 | 110.31 |
| FXD2/2010/15 | 08/12/2025 | 9.000% | 14.34% | 67.76 | 67.83 | 85.82 | 90.40 |
| FXD1/2008/20 | 05/06/2028 | 13.750% | 14.60% | 94.68 | 94.79 | 134.30 | 141.29 |
| FXD1/2011/20 | 05/05/2031 | 10.000% | 14.82% | 69.34 | 70.19 | 72.07 | 72.93 |
| FXD1/2010/25 | 28/05/2035 | 11.250% | 15.04% | 75.55 | 75.64 | 70.91 | 76.63 |
| SDB1/11/30 | 21/01/2041 | 12.000% | 15.25% | 78.94 | 82.96 | 81.03 | 85.06 |
Currency and Interest Rate Outlook
The CBK has attributed the recent sharp fall in the Kenya Shilling to speculative activity. However, we believe the recent moves on both the interest rate front and the currency are reflective of the monetary policy followed by the CBK, specifically of keeping the interest rates too low for too long. Whereas the market interest rates (Treasury Bill and Bond yields) have now corrected to the right levels, the policy rate (Central Bank Rate) remained too low at 6.25%. The last time inflation was at these levels – in early 2009 – the CBR was at 8.25%, 200 basis points higher than the current level. The only interest rate directly linked to the CBR was the rate at which commercial banks borrow from the Central Bank on an overnight basis. The borrowing through this window has been leaping:
| Week Ended | Commercial Banks Borrowings from CBK |
|---|---|
| June 1, 2011 | KSH 3.8 bn |
| June 8, 2011 | KSH 30.4 bn |
| June 15, 2011 | KSH 56.4 bn |
| June 22, 2011 | KSH 127.9 bn |
| June 29, 2011 | KSH 102.22 bn |
Undoubtedly, some of this cheap funding from the CBK was being used by the commercial banks to take speculative positions in the foreign exchange market. In realization of this, the Central Bank de-linked the overnight borrowing rate of commercial banks from the CBR on 29th June, 2011 and set a rate of 8.00% for the overnight window. This has had the desired effect and capped the exchange rate of the Kenya Shilling for now.
This now brings into question the relevance of the Central Bank Rate (CBR) – this was already a weak signalling device, whose only direct relevance was the rate at which commercial banks could borrow from the CBK. With the overnight borrowing rate now being de-linked from the CBR, there is no useful purpose served by the CBR.
We believe that the major correction in the interest rates that we had forecast in our February newsletter is now complete. We expect the 91-day Treasury bill rate to gradually drift lower, to a level of 8.00% – 8.50% in the next 3 months. We also expect the Kenya Shilling exchange rate to be capped below 90.00 to the U.S. Dollar and to trade in a range of 85.00 – 90.00 over the same period.
On the secondary bond markets, major distortions that have been introduced by the nature of trading that has taken place over the last few months. In our May newsletter, we had forecast that the Regulators (CBK, CMA) and the NSE would put an end to such trades. From the lack of concern expressed by any of these bodies at the nature of trades taking place in the market, we have to revise our view, and assume that they will continue to do nothing. The fallout of this will be a substantial drop in the volumes of secondary market trading activity reported by the NSE in the fixed income markets in the second half of 2011 as there is an absence of genuine price discovery on outstanding Treasury bonds, and a continuation of the distorted yield curve for the next few months. The only bonds expected to trade are recent issues, with earlier issues being carried by investors at inflated prices in hold to maturity portfolios that are not subject to mark to market.