Total Kenya Limited is a Kenya-based company, which is principally engaged in the sale of petroleum products. Total Kenya Limited is part of the Total Group, the 4th largest oil and gas company in the world operating in over 100 countries throughout the world. The Company has four business channels: Network, General Trade, Aviation, and Export and Bulk. The Network channel includes the distribution of petroleum products through service stations located all over Kenya. The General Trade channel includes sales of a range of products to all sizes of industrial consumers. The Aviation channel includes sales of turbine kerosene and aviation gasoline to local and international air carriers. The Export and Bulk channel includes sales of the Company's range of products to neighbouring countries and some other industry players.
In 2009 Total Kenya acquired Chevron (Caltex) Company in Kenya. Under the terms of the sales, Total Oil acquired Chevron’s marketing businesses in Uganda and Kenya. Chevron Kenya Limited and Chevron Uganda Limited’s assets included 165 Caltex-branded service stations, one terminal, seven fuel depots, six aviation facilities, one lubricants blending plant, and a commercial and industrial fuels business. Chevron Kenya’s assets at the time of the deal were valued at KES 12 billion.

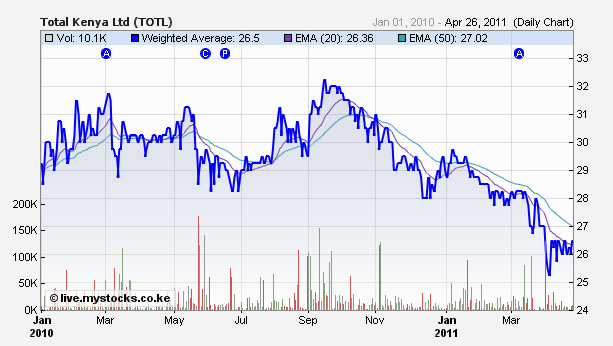
Total Kenya is trading close to its 1 year low, despite having declared good results for 2010. At its current price, it is trading at a P: E ratio of 5.77 and Price: Book multiple of 0.81. The share has traditionally under-performed the market. However, we believe that the market has not factored in the impact of its acquisition of the Kenyan operations of Chevron in 2010, which has contributed significantly to its market share, book value and earnings. We believe that the counter needs to be re-rated by the market.
| Income Statement (KES ‘mn) | FY Dec 09 | FY Dec 10 | y/y % Change |
|---|---|---|---|
| Sales | 32,677 | 64,362 | 97% |
| Cost of Sales | (29,868) | (59,045) | 98% |
| Gross Profit | 2,809 | 5,317 | 89% |
| Gross Profit Margin | 9% | 8% | -4% |
| Admin & Optg Costs | (396) | (976) | 146% |
| Finance Cost Net | (576) | (955) | 66% |
| Operating Expenses | (1,388) | (2,564) | 85% |
| Other Income | 283 | 568 | 101% |
| PBT | 732 | 1,390 | 90% |
| Tax | (251) | (472) | 88% |
| PAT | 481 | 918 | 91% |
| Pref Dividends | 123 | 130 | 6% |
| Profit Attributable to Equity Shareholder | 358 | 788 | 120% |
| EPS Equity Shareholders | 2.05 | 4.5 | 120% |
| DPS Equity Shareholders | 1 | 1.05 | 5% |

