
Overnight interest rates went on a roller coaster ride in August, rising from 6.7% on 10th August to a high of 28.40% on 26th August and then down below 6% by 9th September. In our last month’s newsletter we had forecast that our Pessimistic scenario of interest rates was starting to play out and that the 91-day Treasury bill would rise to 11-12% in the next few months. The huge volatility in rates increased the risk premiums in the market, pushing 91-day Treasury Bill rates beyond our target range in a period of less than 1 month, to a high of 13.19% in this weeks auction.
With the volatility in interest rates witnessed for the past few months as well as tight liquidity conditions, the CBK has been unsuccessful in managing to raise any fresh borrowing for the year – in fact as at 9th September, the net borrowing was negative KES 7.4 bn., and further repayments have been made at the latest auction of Treasury Bills and Bonds.
In order to meet the shortfall, the Government has been drawing on its overdraft line at the CBK, which has been at a level of KES 25.4 bn since 26th August. The Government’s overdraft at the CBK is subject to a limit, which has been reached in August and is likely to have been exceeded in September. This leaves the CBK with no room to manoeuvre on the interest rate front.
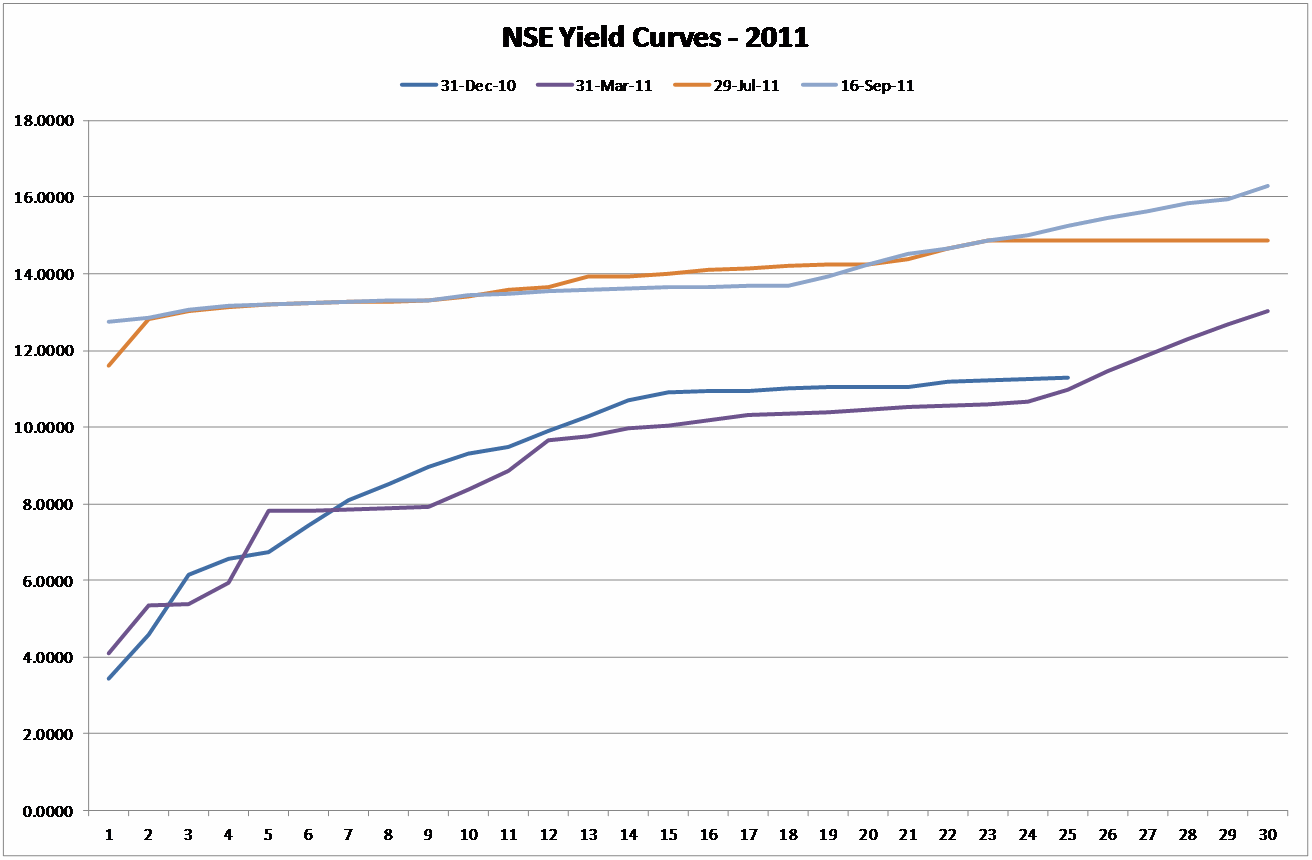
The Yield curve has been moving up in the last few months and has also started to slope upwards at the long-end, as price discovery takes place through fresh issues of long-dated papers.
The volatility in short-term interest rates since mid-August has made it difficult to call a top to the current rate cycle. Banks, as the largest segment of investors in Government Securities have been reducing their investments in Government securities, as shown in the table below:
| Investment by Banks in Government Securities (Treasury Bills and Treasury Bonds) | |||
|---|---|---|---|
| 30/06/2010 | 30/06/2011 | 09/09/2011 | |
| Total Government Securities – KES mn | 608.1 | 722.4 | 715.0 |
| Banks share of outstanding Government securities – % | 57.6% | 52.1% | 48.4% |
| Banks Holdings of G-Secs – KES mn | 350.3 | 376.4 | 346.1 |
Banks’ current holding of Government securities is now lower than what it was in June 2010. With bank balance sheets having grown substantially (20%+) in the period, the proportion of banking industry’s assets held in government securities will has declined very sharply. This is obviously not a sustainable position for either the Investor (Banking industry) or the Investee (CBK/ Government).
With the wide spread now available in the market between the overnight rates (below 6%) and the 91-day T-Bill rate (above 13%), we expect to see banks giving up their preference for cash and beginning to buy the short-end of the curve. We therefore see the short-end of the curve (less than 2 years) pulling back in the next few weeks. However, the current fragile state of the international markets is leading to risk aversion globally. Until the international markets return to some semblance of normalcy, we do not see much relief at the long-end of the yield curve or indeed for the Kenya Shilling against international currencies.