
Last year saw the two listed oil firms display mixed performance at the bourse. Kenol Kobil , the larger of the two with a market cap of over KES 12 billion, returned a disappointing 25.5% drop in market price despite returning into profitability following a KES 147.3 million in profit after tax in the six months ending June. Total Kenya on the other hand scored an impressive 78.7% return spurred by a KES 461.3 million profit after tax recorded in the same reporting period. Overall market share (including exports) for the period January – September 2013 places Total at 16.8% with Kenol following behind at 12.8% according to Petroleum Institute of East Africa.
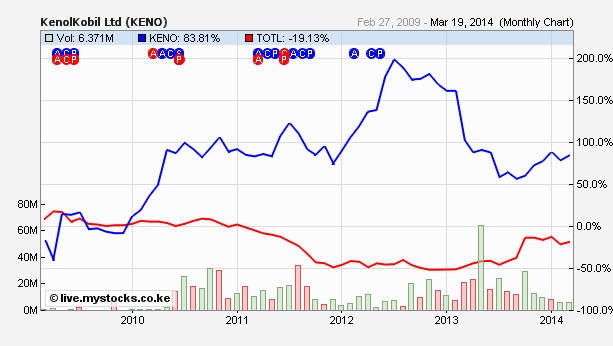
All that said. Share prices of both firms have continued to display contrasting performance despite more or less similar fundamental performance. Notwithstanding the nuances of their operating mandates, one could expect their share prices to positively trace each other owing to the above fact. But that is not the case, interestingly, correlation on the two oil stocks going back four years reveals a different position: a negative correlation of 0.57. This means that when either stock goes up in price, the other goes down and vice versa.
This unique relationship provides an opportunity for profitable correlation play. Market participants’ seeking to hedge their bets and to limit portfolio volatility in the oil sector can buy both stocks. On the other hand, trend traders betting on either of the two equities can choose to rotate their holdings through exiting in the recent highest performer and investing in the recent poor performer as guided by the correlation cycle. This simple strategy also provides diversification benefits. This is because poor performance in one investment can be offset by better (or even good) performance in another therefore extreme losses will be rarer than otherwise, and the capital will grow more in the long run.
Why the Strategy Works
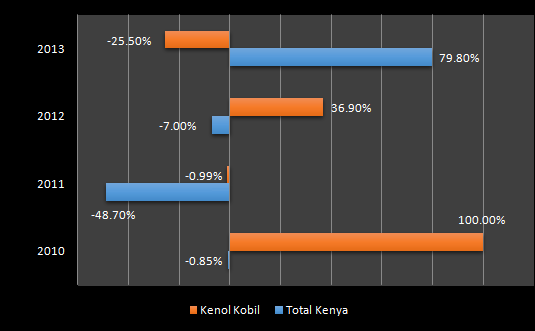
In the adjacent bar chart, since 2010, annual price performance for the two stocks clearly demonstrates why the strategy is a winner. In 2013, while Kenol lost 25.5%, Total Kenya gained 79.8% in the same year. In the prior year, the reverse occurs, the later loses 7% while the former advances 36.9%. In 2010, while Kenol doubles in price from KES 5 to KES 10, Total registers a marginal drop of 0.85%. Overall, Kenol comes out ahead with an annual compounded growth of 15.2% in the period while Total records a negative 3.3% proving that the correlation strategy works.
Strategy Challenges
Notwithstanding the obvious benefits of the strategy, traders stand to face numerous challenges key to its success. First improper or ill-timed entries could negate the effectiveness of the strategy and perhaps lead into losses. Investors betting in either of the two stocks should be able to rightly call the tops and bottoms before initializing any positions. This is a major challenge since no one can truly time equity tops or bottoms.
Secondly, the standing correlation itself poses a challenge since it is not permanent. If the correlation between the stocks ever falls apart this means the strategy would no longer work as in the past. Correlation for the 2013 stands at -0.55, a lower average compared to the four year average.
Conclusion
Traders are advised to use the above strategy with caution. The upside is huge if implemented correctly but the opposite holds true if executed carelessly.