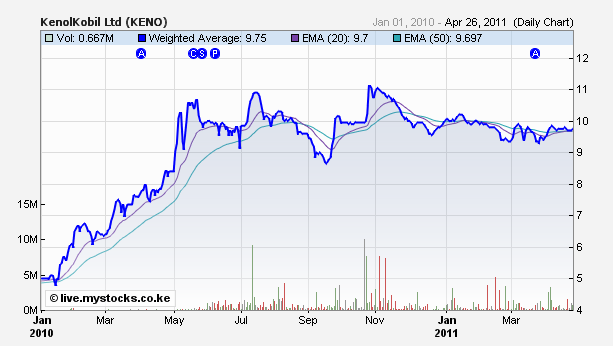
Kenol Kobil Limited is engaged in the importation of crude oil for refining, trading, storage and distribution of refined and other petroleum products. The Company offers fuel products (both white and black), lubricants, LPG, and non-fuel goods like mobile phone scratch cards, tyres and car batteries, among others. Kenol Kobil operates in Kenya, Tanzania, Uganda, Rwanda, Zambia and Ethiopia. Its subsidiaries include Kobil Uganda Limited, Kobil Tanzania Limited, Kobil Zambia, Kobil Ethiopia and Kobil Rwanda SARL.
The company has been diversifying both its product range as well as its geographical spread, which has reduced its dependence on Kenyan retail market to below 50%. In 2010, a dispute with Kenya Petroleum Refineries Limited (KPRL) led to its being locked out of supplies from the refinery for over 2 months. The dispute has since been resolved. Kenol Kobil has an ongoing claim against Kenya Pipelines Limited (KPL) for which it has received an arbitration award of KES 4.5bn which is being contested by KPL in court.

Kenol Kobil reported impressive result for year 2010 despite challenges the company had particularly with KPRL. It is trading at a historic P: E ratio of 8.12, Price: Book multiple of 1.12 and a dividend yield of 5.3%. Group assets revaluation is expected to be done in 2011, which will result in increase in asset value and hence discounted P/B. We believe that the prospects of Kenol Kobil are positive and expansion as well as regional and product diversification will drive earnings growth. The stock is substantially undervalued and we expect it to be re-rated by the market during the year.
| Income Statement (KES'mn) | FY Dec 09 | FY Dec 10 | y/y % Change |
|---|---|---|---|
| Sales | 96,693 | 101,761 | 5.24% |
| Cost of Sales | (90,655) | (94,053) | 3.75% |
| Gross Profit | 6,038 | 7,708 | 27.66% |
| GP Margin | 6.2% | 7.6% | 21.30% |
| Distribution Cost | (1,082) | (1,043) | -3.60% |
| Admin & Optg Costs | (2,875) | (2,997) | 4.24% |
| Finance Costs | (454) | (970) | 113.66% |
| Other Income | 307 | 0.928 | -99.70% |
| PBT | 1,934 | 2,699 | 39.55% |
| Tax | (639) | (921) | 44.13% |
| PAT | 1,295 | 1,778 | 37.29% |
| EPS | 0.88 | 1.20 | 36.36% |
| DPS | 0.33 | 0.52 | 60.00% |

